Editing Using Spreadsheet and Curves
The spreadsheet’s columns and the graph editor’s curves are different representations of the same data, so any changes made in one view are also reflected in the other.
Using the Function Editor

The function editor panel is divided into three sections. On the left there is an area where the Spreadsheet or Graph Editor is displayed, on the right top is an area where the interpolation of the current transformation segment is displayed, and on the right bottom is the objects/effects tree.
The tree has two main item folders, Stage and FX: in the first you can find folders for the defined cameras, the table, used pegbars and columns; in the second one you can find folders for each used effect. Each folder contains the related transformation parameters.
The objects/effects tree tells if the object/effect is animated and which parameter is animated, by using the following icons:
A plain folder is for non-animated objects/effects.
A folder with an arrow is for animated objects/effects.
An icon with a dotted straight line is for non-animated parameters.
An icon with a continuous curve is for animated parameters.
Clicking these icons allows you to select which object/effect and which parameters have to be displayed as a spreadsheet or curves in the area on the left.
Transformation data can be saved and loaded as a CURVE file, to allow the exporting and importing from one scene to another, and they can be exported as well as a DAT file in order to be used in other software.
Tip
To resize the Function Editor sections:
Do any of the following:
Click and drag the separators to resize sections.
Click and drag a separator toward the panel border to hide a section.
Click and drag the separator collapsed to the panel border toward the panel center to display again the hidden section.
Tip
To display or hide column parameters:
Retrieve the object or the effect in the objects/effect tree.
Do one of the following:
Click the folder to display or hide all columns or curves related to its parameters.
Click the parameter icon to display or hide its related column or curve.
Click a parameter icon and drag to display or hide all the columns or curves you pass upon.
Right-click the folder and choose Show Animated Only from the menu that opens to display or hide only the animated columns or curves related to its parameters.
Right-click the folder and choose Show All from the menu that opens to display or hide all columns or curves related to its parameters.
Tip
To open the Graph Editor in a separate panel:
Make sure the option Graph Editor Opens in Popup is selected from the Function Editor: dropdown menu, in the Preferences → Interface window. (Restart Tahoma).
Click the Function Editor Toggle button (
 ) in the top bar of the Function Editor.
Tip
To open the Spreadsheet in a separate panel:
Make sure the option Spreadsheet Opens in Popup is selected from the Function Editor: dropdown menu, in the Preferences → Interface window. (Restart Tahoma).
Click the Function Editor Toggle button (
) in the top bar of the Function Editor.
Tip
To switch between Spreadsheet and Graph Editor in the Function Editor:
Make sure the option Toggle Between Graph Editor and Spreadsheet is selected from the Function Editor: dropdown menu, in the Preferences → Interface window. (Restart Tahoma).
Click the Function Editor Toggle button (
) in the top bar of the Function Editor.
Tip
To scroll the Spreadsheet:
Do one of the following:
Middle-click and drag to scroll in any direction.
Use the mouse wheel to scroll up or down.
Use the scrolling bars to scroll only within the actual spreadsheet extent.
Use the Up Arrow and Down Arrow keys to move one frame up or down.
Use the Page Up and Page Down keys to scroll the visible frames up or down.
Use the Home and End keys to scroll up to the beginning or the end of the Xsheet/Timeline content.
Tip
To navigate the Graph Editor:
Do one of the following:
Use the mouse wheel, or the zoom shortcut keys (by default + and - keys) to zoom in and zoom out.
Click in the horizontal ruler and drag up to zoom in horizontally, down to zoom out; click in the value vertical ruler and drag up to zoom in vertically, down to zoom out.
Middle-click and drag the graph area to scroll in any direction, the horizontal ruler to scroll horizontally, and the vertical ruler to scroll vertically.
Use the reset view shortcut (by default the Alt + 0 key) or right-click the graph area and choose Fit from the menu that opens, to display all the visible curves in the current Function Curve Editor panel.
Tip
To save transformation data:
Right-click the relevant parameter in the objects/effects tree, and choose Save Curve from the menu that opens.
Use the Browser to choose a name and location for the file to be saved: the data will be saved as a CURVE file.
Tip
To load transformation data:
Right-click the relevant parameter in the objects/effects tree, and choose Load Curve from the menu that opens.
Use the Browser to retrieve the curve to load; valid files are in CURVE format.
Tip
To export transformation data:
Right-click the relevant parameter in the objects and effects tree, and choose Export Data from the menu that opens.
Use the Browser to choose a name and location for the file to be saved: the data will be saved as a DAT file that can be used in other software supporting this type of information.
Defining keyframes
Keyframes, including those belonging to object transformations done by using the Animate tool ( ) and those defined for effects parameters in the FX Settings panel, can be controlled and edited both using the Spreadsheet’s numerical columns and the Graph Editor’s curves (see Animating Objects and Editing FX Settings ).
In the Spreadsheet, keyframes are displayed as orange cells; in the Graph Editor, keyframes are represented as control points along the curve. In both cases they can be added, edited, moved and deleted.
Using the Spreadsheet
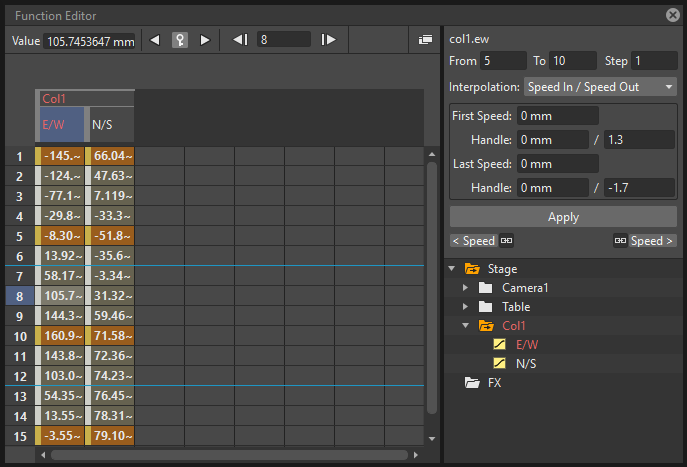
The Spreadsheet displays transformations in columns like the ones available in the Xsheet/Timeline, having one for each parameter. For each frame, the column’s cells display the related transformation values.
Keyframes are displayed in different-colored cells, and can be moved along the column to different frames positions. In-between values are automatically generated according to the keyframes and to the set interpolation (see Setting Segment Interpolations ).
All the columns referring to the same object or effects are grouped under one single header. For example under a pegbar header you can find all the columns referring to its transformations.
Columns cells can be used to type in directly values for keys, edit or move them. Values contained in cells can be cut, copied and pasted, so that transformations can be displaced, repeated and deleted.
Tip
To define keyframes directly in Spreadsheet columns:
Double click in the column cell where you want to define a keyframe: the cell becomes editable.
Type in the value for the key, and press Enter to confirm.
Tip
To move a keyframe:
Click the vertical strip at the left of a keyframe cell, and drag it up or down to the new position; the in-between values change accordingly.
Tip
To displace the channel along the column:
Click the vertical strip at the left of the selected column cells, and drag it up or down to the new position: the content of the segments completely included in the selection will move along the column.
Tip
To copy/cut and paste column values:
Do one of the following:
Click and drag to perform a selection; the selection can be extended to several columns.
Use the Copy command: the selection will be kept in memory for further operations.
Use the Cut command: the selection will be removed from the columns and will be kept in memory for further operations. The cells removal causes the following cells to shift up.
Use the Paste command: the selection kept in memory will be pasted starting from the selected insertion cell. The command causes the following cells to shift down.
Use the Delete command: selected cells will be deleted, causing the following cells to shift up.
Using the Graph Editor
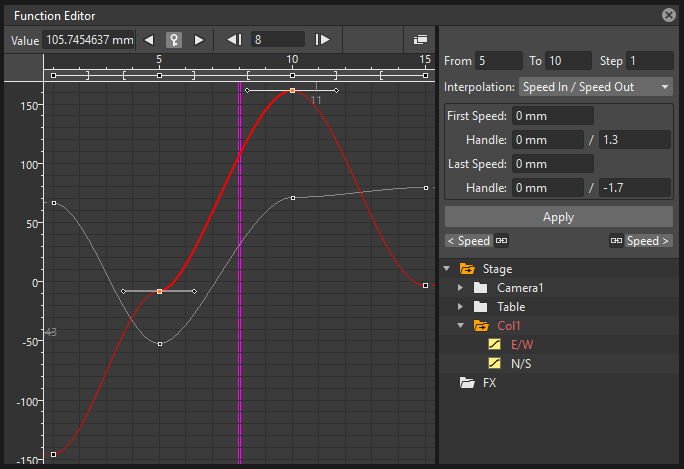
The Graph Editor displays transformations as curves in a graph where time is laid horizontally, and parameter values are laid vertically.
Curves are defined by control points representing keyframes. Points can be easily added by working directly in the graph or using the Set Key button ( ) in the top bar of the Function Editor.
Control points can also be selected in order to be edited, moved or deleted.
The Set Key button () is either grey when no keyframe is defined for the current curve at the current frame, or blue when a keyframe is defined for the current curve at the current frame.
Frames and keyframes can be navigated by using the related buttons in the top bar of the editor. The Next Key ( ) and Previous Key buttons (
 ) are available only if more than one keyframe is defined.
Tip
To set the current curve:
Do one of the following:
Click the related parameter name in the objects/effects tree.
Display the curve in the Graph Editor, then click to select it.
Tip
To set the current frame:
Do one of the following:
Click in the frame horizontal ruler to set a position for the current frame marker.
Click and drag the current frame marker in a horizontal direction.
Type the frame number in the Frame text box, or use the Next Frame and Previous Frame buttons available in the top bar of the editor.
Move the current frame cursor in the Xsheet/Timeline.
Use the frame bar or the playback buttons in the bottom bar of the main viewer.
Tip
To add a keyframe:
Do one of the following:
Click the Set Key button (
) to add a keyframe at the current frame.Type a value in the Value text box to add a keyframe at the current frame.
Right-click and choose Set Key from the menu that opens.
Ctrl-click (PC) or Cmd-click (Mac) the curve where you want to add the keyframe point to it.
Tip
To remove a keyframe:
Do one of the following:
Select the keyframe to remove and choose Edit → Delete.
Set the current frame where a keyframe is and click the Set Key button (
).
Tip
To select keyframes:
Do one of the following:
Click to select a keyframe.
Shift-click to add a keyframe to or remove it from the selection.
Click and drag to select all of the keyframes that are in the area you define.
Tip
To select curve segments:
Select the segment or the control points at the ends of the segment.
Tip
To move the selection:
Click and drag any of the selected control points.
Tip
To edit curves:
Do one of the following:
Use the Copy command: the selected segments will be kept in memory for further operations.
Use the Cut command: the selected segments will be removed from the curve and will be kept in memory for further operations.
Use the Paste command: the segments kept in memory will be pasted starting from the selected keyframe, preserving any other previously defined keyframes not replaced by the new ones.
Use the Delete command: the selection will be deleted.
Tip
To navigate keyframes for the current curve:
Use the Next Key () and Previous Key buttons () available at the sides of the Set Key button.
Tip
To cycle previously created keyframes:
Right-click the dashed line after the end of the curve and choose Activate Cycle from the menu that opens.
Tip
To disable the cycle:
Right-click the curve and choose Deactivate Cycle from the menu that opens.
Note
Only keyframes included in the selection are considered when performing copy, cut and paste operations.
Note
All the Edit menu commands are also available in the menu that opens when right-clicking in the Xsheet/Timeline cells.
Setting Segment Interpolations
A transformation segment, that is to say the section between two keyframes, can have different interpolations affecting the way the value changes from one key to another. The set interpolation will be displayed graphically in the Graph Editor, and as a series of values, one for each frame, in the Spreadsheet.
Available interpolations are the following: Linear, Speed In / Speed Out, Ease In / Ease Out, Ease In / Ease Out %, Exponential, Expression, File, Constant and Similar Shape. The default interpolation can be set in the Preferences → Animation panel, but the interpolation can be changed at any time in the interpolation area of the Function Editor, on the top right of the panel.
In the same area it is also possible to define an interpolation Step, that is to say the number of frames for which the interpolation values have to be repeated, for instance to match a movement with an animation level exposed at a specific step. The default animation step can be set in the Preferences → Animation window.
Tip
To set the type of interpolation for a segment in the Spreadsheet:
Move the current frame cursor to a frame belonging to a segment.
Choose the interpolation from the option menu available in the Interpolation: area of the Function Editor.
Click the Apply button to apply the desired change.
Tip
To set the type of interpolation for multiple segments in the Spreadsheet:
Make a cell selection that encompasses multiple keyframe segments.
Right click on one of the selected cells and choose the desired interpolation type in the menu that opens.
Tip
To set the type of interpolation for a segment in the Graph Editor:
Set the segment by doing one of the following:
Click a segment to select it.
Move the Current Frame Marker to a frame belonging to a segment.
Choose the interpolation from the dropdown menu available in the Interpolation: area of the Function Editor.
Click the Apply button to apply the desired change.
Note
The interpolation options are also available when right-clicking a segment.
Tip
To set the Step of the interpolation:
Specify the Step value in the interpolation area of the Function Editor.
Click the Apply button to apply the desired change.
Using Linear Interpolations
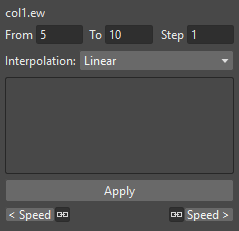
When the interpolation is Linear the curve segment turns to a straight line and the speed of the transformation is constant.
Tip
To set a Linear interpolation:
Do one of the following:
Choose Linear from the option menu available in the Interpolation area of the Function Editor and click the Apply button.
Right-click the curve segment you want to set the interpolation for, and choose Linear Interpolation from the menu that opens.
Using Speed In / Speed Out Interpolations
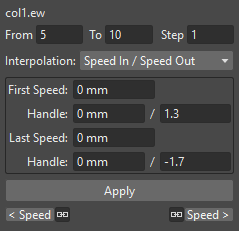
When the interpolation is Speed In / Speed Out, both control points at the ends of the segment have handles whose direction and length define the slope of the curve, therefore the speed of the transformation. The handles direction and length can be set by entering values in the Interpolation area of the Function Editor, or by dragging the handles themselves.
By default the handles are linked, making their degree of movement dependent on adjacent segments in order to define a smooth curve, but the link can be broken in order to move the handle freely. For example if subsequent segments have the Speed In / Speed Out interpolation, the handles of the shared points share the same direction, but breaking the link each handle can have a different direction.
Handles can also be collapsed in control points in order to turn them into corner points; in this case to retrieve the handles it is possible to reset their length and direction.
Tip
To set a Speed In / Speed Out interpolation:
Do one of the following:
Choose Speed In / Speed Out from the dropdown menu available in the Interpolation area of the Function Editor and click the Apply button.
Right-click the curve segment you want to set the interpolation for, and choose Speed In / Speed Out Interpolation from the menu that opens.
Tip
To set the speed of the interpolation:
Select the keyframe at the beginning or at the end of the curve segment you want to edit, or the curve segment itself.
Set the slope of the curve after or before the keyframe by doing one of the following:
Enter the Speed In and Speed Out direction and length values in the Interpolation area of the Function Editor and click the Apply button.
Click and drag the end of the handles to move them freely.
Shift-click and drag the end of the handles to move them with a constraint in the horizontal or vertical direction.
Tip
To move a control point handle free from the adjacent segments:
Right-click the control point and choose Unlink Handles from the menu that opens.
Tip
To link back handles to adjacent segments:
Right-click the control point and choose Link Handles from the menu that opens.
Tip
To turn a control point into a corner point:
Select the control point.
Move the handle ends to the control point, in order to collapse them.
Tip
To retrieve handles from a corner point:
Right-click the control point and choose Reset Handles from the menu that opens.
Using Ease In / Ease Out Interpolations
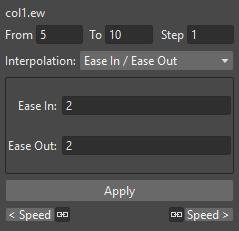
When the interpolation is Ease In / Ease Out, the segment is divided into three sections by two vertical lines: the first section is an acceleration, the second is at constant speed, the third is a deceleration. The duration in frames of each section can be set by entering values in the Interpolation area of the Function Editor, or by dragging the vertical lines available on the segment.
Tip
To set an Ease In / Ease Out interpolation:
Do one of the following:
Choose Ease In / Ease Out from the dropdown menu available in the Interpolation area of the Function Editor and click the Apply button.
Right-click the curve segment you want to set the transformation for, and choose Ease In / Ease Out Interpolation from the menu that opens.
Tip
To set the Ease In / Ease Out of the interpolation:
Select the keyframe before or after the Ease In / Ease Out curve segment you want to edit, or the curve segment itself.
Do one of the following:
Enter the Ease In and Ease Out values in the Interpolation area of the Function Editor and click the Apply button.
Move the vertical line setting the Ease In or Ease Out section of the segment, to change the curve after or before the keyframe.
Using Ease In / Ease Out % Interpolations
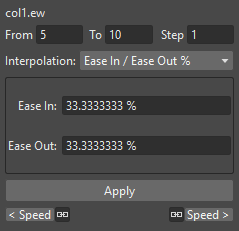
The Ease In / Ease Out % interpolation is similar to the Ease In / Ease Out one, but the Ease In and Ease Out sections of the segments are expressed as a percentage of the segment frame duration.
Tip
To set an Ease In / Ease Out % interpolation:
Do one of the following:
Choose Ease In / Ease Out % from the dropdown menu available in the Interpolation area of the Function Editor and click the Apply button.
Right-click the curve segment you want to set the transformation for, and choose Ease In / Ease Out % Interpolation from the menu that opens.
Tip
To set the Ease In / Ease Out % of the interpolation:
Select the keyframe before or after the Ease In / Ease Out curve segment you want to edit, or the curve segment itself.
Do one of the following:
Enter the Ease In and Ease Out values in the Interpolation area of the Function Editor and click the Apply button.
Move the vertical line setting the Ease In or Ease Out section of the curve segment, to change the curve after or before the keyframe.
Using Exponential Interpolations

When the interpolation is Exponential the curve segment turns to a curve that continually becomes steeper, because of that, the higher the frame, the faster the related value grows. Only positive values are significant for this interpolation.
Tip
To set an Exponential interpolation:
Do one of the following:
Choose Exponential from the dropdown menu available in the Interpolation area of the Function Editor and click the Apply button.
Right-click the curve segment you want to set the transformation for, and choose Exponential Interpolation from the menu that opens.
Using Interpolations Based on Expressions
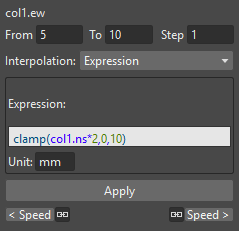
When the interpolation is defined by an Expression, the segment values come from a mathematical formula that can be typed by using algebra notations. In this case the keyframes at both ends of the segment may change as well, according to the typed expression.
While typing the expression, if the syntax is recognized, a menu automatically opens suggesting you the possible terms: from the menu you can select the term both to display in a tooltip box its correct syntax, and to insert it in the expression.
As soon as terms are recognized, different colors are used to highlight them: operators and functions are displayed in dark blue, variables in light blue, constants in green. When the expression is entered, any syntax error will be displayed in red.
The Unit used for the function is displayed in a box next to the expression; in case the unit refers to a movement, the default unit can be changed, and the values will be automatically converted to the default one.
Apart from the standard operators and functions, some variables and predefined functions can also be used in expressions.
Supported terms are the following:
Operators |
|
|---|---|
|
Addition, Subtraction, Multiplication, Division |
|
Modulus: |
|
Exponentiation: |
Math Functions |
||
|---|---|---|
|
Angles are expressed in degrees. |
|
|
Hyperbolic functions. |
|
|
||
|
The greatest whole number less or equal than |
|
|
The smallest whole number less or equal than |
|
|
The integer closest to |
|
|
Absolute value: |
|
|
Returns 0 if |
|
|
Returns square root of |
|
|
Returns argument with minimum value. |
|
|
Returns argument with maximum value. |
|
|
Returns |
|
|
Returns |
|
|
Returns 0 if |
|
|
Returns 0 if |
Logical Operators |
|
|---|---|
|
Less |
|
Less or equal. |
|
More |
|
More or equal. |
|
Equal. |
|
Not equal. |
Boolean Operators |
|
|---|---|
|
And. |
|
Or. |
|
Not. |
Conditional Expression |
|
|---|---|
|
If |
Variables |
|
|---|---|
|
Ranges from 0.0 to 1.0 along the transition allowing position/length-independent transitions. |
|
The current frame number. |
|
It is relative to the transition. |
Constants |
|
|---|---|
|
3.141593… |
numeric constant |
E.g. 1, 2, 4.3. |
Predefined Functions |
|
|---|---|
|
Cycles the transition of the |
|
Generates a pulse ranging from 0.0 to 1.0 set at position |
|
Generates a bump ranging from 0.0 to 1.0 set at position |
|
Generates random sequences between 0.0 and 1.0. |
|
Generates a random number between 0.0 and |
|
Generates a random number between |
|
Works like random, but allows the user to specify the |
|
Like above, with |
|
Like above, with |
|
Generates a periodic sawtooth shaped curve according to the |
|
Generates a periodic sawtooth shaped curve according to the |
|
The same as |
Note
The predefined function saw , wave and pulse use implicitly a variable independent from the frame number. You can provide explicitly a variable using the form: fun (var; argument...) .
Tip
To set an interpolation based on an Expression:
Do one of the following:
Choose Expression from the dropdown menu available in the Interpolation area of the Function Editor and click the Apply button.
Right-click the curve segment you want to set the transformation for, and choose Expression Interpolation from the menu that opens.
Tip
To set the expression:
Type the expression in the Interpolation area of the Function Editor. As you type, if the syntax is recognized, a menu automatically opens suggesting you the possible terms.
Press Enter to submit the expression and check its syntax.
If the expression refers to a movement, change the unit if needed.
Press the Apply button to apply the desired change.
Tip
To select a suggested term:
Do one of the following:
Use the Up Arrow and Down Arrow keys to select the term in the menu that opens, then press Enter.
Click the term in the menu that opens.
Note
When selecting a term with the Arrow keys a tooltip box displays the term correct syntax.
Using Transformation References
It is possible to use in expressions references to any object, effect or Plastic vertex transformation. In this way, expressions can be used to create relationships between different transformations belonging to different items that can be of any of the aforementioned types.
The syntax to create a reference to an object transformation is the following:
object.transformation or object.transformation(delta)
where object is the ID name of a camera, column, pegbar or the table, as can be read in the Stage and FX Schematic nodes’ tooltips; transformation can be any of its available transformations; and delta is the difference between the target frame and the current one.
For example camera1.y refers to the Position Y of Camera1.
Whereas camera1.y(f-5) refers to the Position Y of Camera1, 5 frames before the current frame.
Supported terms are the following:
Objects |
|
|---|---|
|
Refer to the camera |
|
Refers to the column |
|
Refer to the pegbar |
|
Refer to the table. |
Note
In expressions, timeline layers will always be referred to as columns.
Transformations |
|
|---|---|
|
Refer to the horizontal and vertical position. |
|
Refer to the position along the motion path. |
|
Refers to the rotation. |
|
Refer to the global, horizontal and vertical scaling. |
|
Refer to the horizontal and vertical shear. |
|
Refers to the position along the Z axis. |
Note
ew and ns transformation names are retained for compatibility with other Toonz derived programs expressions.
The syntax to create a reference to an effect parameter is the following:
fx.name.parameter or fx.name.parameter(delta)
where name is the ID name of an effect, as can be read in the FX Schematic nodes’ tooltips, parameter is any of the available effect parameters, and delta is the difference between the target frame and the current one.
When an effect parameter has multiple sub-parameters, for example the Center parameter has X and Y sub-parameters, the syntax has to be the following:
fx.name.parameter.subparameter or fx.name.parameter.subparameter(delta)
where name can be any used effect, parameter the main effect parameter, subparameter is the effect sub-parameter, and delta is the difference between the target frame and the current one.
For example fx.blur2.value refers to the Value parameter of the effect Blur2; fx.blur2.value(f-5) refers to the Value parameter of the effect Blur2, 5 frames before the current frame; and fx.raylit1.center.x refers to the X sub-parameter of the Center parameter of the effect Raylit1.
Note
If the effect parameter name consists of several words, they have to be typed in expressions without blank spaces.
The syntax to create a reference to a Plastic vertex transformation is the following:
vertex(column_number, "vertex_name").transformation or vertex(column_number, "vertex_name").transformation(delta)
where column_number is the ID number of the column in which the referenced vertex exist, vertex_name is the exact name of the referenced Plastic vertex, transformation is any of the available vertex transformations (see below), and delta is the difference between the target frame and the current one.
Plastic Vertex Transformations |
|
|---|---|
|
Refers to the angle between the vertex and its parent. |
|
Refers to the distance between the vertex and its parent. |
|
Refers to the vertex sorting order. |
See Use Mathematical Expression in Plastic Animation for further details on animating a Plastic mesh using expressions.
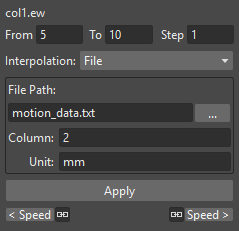
Using Interpolations Based on File Data
When an interpolation is based on File data, the segment values are retrieved from the contents of a file. In this case the keyframes at both ends of the segment may change as well, according to the file data.
The file can be created by an external device or other applications, such as motion-control cameras or 3D software; supported file formats are BAT, DAT, RTF and TXT.
The value for each frame is taken from the file content, that must consist of a series of numbers listed in several lines.
In case the file contains several values in each line, it is possible to define which value in each line has to be used by specifying a column number. For example, if you have a file like this:
100, 200, 300
101, 201, 301
102, 202, 302
the value 2 will cause 200, 201, 202 to be loaded.
The unit used for the data is displayed in a box next to the file path; in case the unit refers to a movement, the default unit can be changed, and the values will be automatically converted to the default one.
Tip
To set an interpolation based on File data:
Do one of the following:
Choose File from the option menu available in the Interpolation area of the Function Editor and click the Apply button.
Right-click the curve segment you want to set the transformation for, and choose File Interpolation from the menu that opens.
Tip
To set the File information:
Type in the File Path field, or use the browser button, to set the path to the data file.
Specify which value in each line has to be used by specifying the Column number.
If the File data refers to a movement, change the unit if needed.
Note
If in the Browser you choose any project default folder, in the path field the full path will be replaced by the related default folder alias (see Project Default Folders ).
Using Constant Interpolations
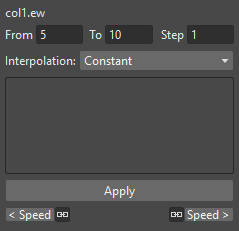
When an interpolation is Constant, the segment values are always equal to the value of the first key defining the segment.
Tip
To set a Constant interpolation:
Do one of the following:
Choose Constant from the option menu available in the Interpolation area of the Function Editor and click the Apply button.
Right-click the curve segment you want to set the interpolation for, and choose Constant Interpolation from the menu that opens.
Using Interpolations Based on Similar Shapes
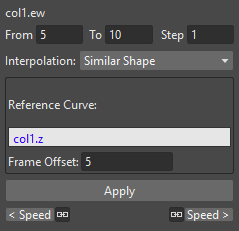
When the interpolation is based on a Similar Shape, the segment values changes according to the shape of the curve you specify as reference (see Using Transformation References ). As soon as the interpolation is set, whenever the reference curve is edited, the segment will change accordingly.
This interpolation proves useful when you want to control at once several curves: if all of them share the same reference curve, by modifying the reference curve you will modify automatically all the curves referring to it.
It is also possible to set a Frame Offset value so that the interpolation will refer not to the same frame range of the reference curve, but to a different one.
Tip
To set an interpolation based on a Similar Shape:
Do one of the following:
Choose Similar Shape from the option menu available in the Interpolation area of the Function Editor and click the Apply button.
Right-click the curve segment you want to set the transformation for, and choose Similar Shape Interpolation from the menu that opens.
Tip
To set the reference curve:
Set the Reference Curve: in the Interpolation area of the Function Editor by typing the reference to an object or an effect transformation by using the appropriate syntax (see Using Transformation References ).
Set a Frame Offset in the Interpolation area of the Function Editor if you want the interpolation to refer not to the same frame range of the reference curve, but to a different one.
Click the Apply button to apply the desired change.
Controlling Several Function Curves at the Same Time
It’s possible to control the keys and the interpolations of all the function curves visualized in the Function Editor by using widgets available in a horizontal strip at the top of the Graph Editor area, below the frame ruler.
This allows you to define keys and control the interpolation speed for different curves at the same time, such as a camera truck and pan, or an effect animation and a pegbar movement.
With respect to keys, a keyframe is visible in the strip for each keyframe defined for any curve visible in the Graph Editor; a line connects the keyframes for all the frames where there is an animation going on. The strip keyframe can be moved, automatically moving the keyframes it refers to; in case the strip keyframe refers to keyframes at the same frame in several curves, all the keyframes will move along.
With respect to interpolation, if all the visible curves have a key at the same specific frame, and the segment on the side of the key has the same Ease In / Ease Out value or the same Speed In / Speed Out horizontal component, a marker will be visible in the strip on the side of the strip keyframes. The marker shaped as an opening square bracket is for the segment to the right of the keyframe, the one shaped like a closing square bracket is for the segment on the left of the keyframe. The markers can be moved, automatically changing the Ease In / Ease Out or the Speed In / Speed Out values of all the segments they refer to.
Tip
To set which curves have to be controlled:
Display the curves in the Graph Editor (see Using the Graph Editor ).
Tip
To add a keyframe:
Ctrl-click (PC) or Cmd-click (Mac) the frame ruler where you want to add the keyframe: a keyframe will be added to all the visible curves.
Tip
To move a keyframe:
Click and drag the strip keyframe: all the keyframes it refers to will move along.
Tip
To control the speed of the interpolation:
Move the markers visible on the sides of the strip keyframes.